Don’t want to send CyberArk your Telemetry data?
This blog is a walkthrough on installing, configuring, and deploying CyberArk Telemetry tool and script to send the data to your SIEM for your CyberArk On-Prem environment. This is building upon what James Creamer from CyberArk has previously blogged about.
Purpose:
To use CyberArk’s Telemetry tool for On-Prem CyberArk environments only (don’t send data to CyberArk), and instead send the data to your SIEM. This then allows you to create your own related dashboards.
Prerequisites —
- On-Prem CyberArk environment, NOT CyberArk P-Cloud
- Utility Server to run the Telemetry Tool, and related scheduled tasks
- CyberArk Telemetry Tool, downloaded from the CyberArk Marketplace — https://cyberark-customers.force.com/mplace/s/#a352J000000lB1MQAU-a392J000001eKbDQAU
- My forked TelemetryTool2SIEM Powershell script — https://github.com/aglerj/TelemetryTool2SIEM .
- Your SIEM configured to ingest the syslog data we’re sending. For example, listen on port 9997, and send those events into index=cyberark. It depends on how your SIEM environment is configured. Check with your SIEM team on what the correct information is.
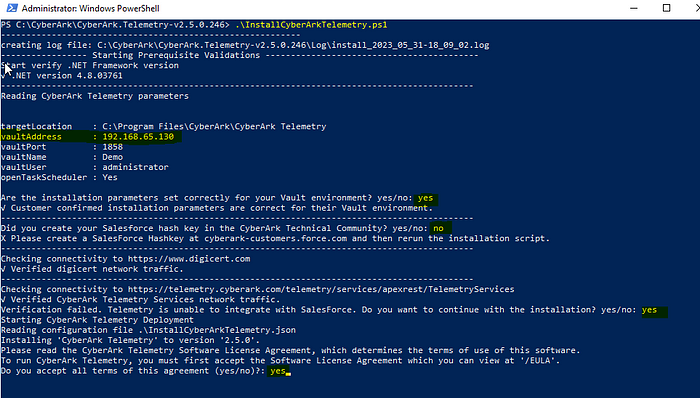
Step 1: CyberArk Telemetry tool setup
- Download, extract and run Install the CyberArk Telemetry Tool to the default path on your utility server. When installing, do not provide a CyberArk key, etc. related to the Telemetry install.


Step 2: Update the config.json file under ConfigFiles
- Adjust the config.json file’s outputAdapters section to only have the jsonfileoutputadapter like shown below. Or, download the config.json file from my github repo (https://github.com/aglerj/TelemetryTool2SIEM/blob/main/config.json), and replace the existing one the Telemetry tool creates.
“outputAdapters”: [ { “name”: “JsonFileOutputAdapter”, “type”: “CyberArk.Telemetry.Output.File.JsonFileOutputAdapter, CyberArk.Telemetry.Output.File”, “enabled”: true, “adapterSettings”: {“outputFilePath”: “Output\telemetryData_#date#.json”} } ]


Step 3: Download and update the Script
- Download the PowerShell script — https://github.com/aglerj/TelemetryTool2SIEM/blob/main/TelemetryToolETL.ps1 . Update the script to utilize your correct SIEM IP and Port. Note that this script utilizes UDP.
#Update to use your Syslog VIP IP here $Syslogserver=”192.168.65.200"
#Update to use your syslog port $port = “9997”

Step 4: Staging the Script
- Stage the updated PowerShell script on the utility server that runs your CyberArk Telemetry Tool scheduled task. On that machine, navigate to the default CyberArk Telemetry folder (C:/Program Files/CyberArk/CyberArk Telemetry). Paste the updated PowerShell script within the ETL folder.
Step 5: Modify the Scheduled Task
- Launch task scheduler and edit the CyberArk Telemetry task by right clicking on it and selecting properties. Under the Actions tab, add a new action to launch the PowerShell script. Program/script: powershell Add arguments (optional): -NoProfile -NoLogo -NonInteractive -ExecutionPolicy Bypass -File “C:\Program Files\CyberArk\CyberArk Telemetry\ETL\TelemetryToolETL.ps1” Press OK.


Step 6: Run the Scheduled Task on-demand
- Right click on the scheduled task and run on-demand. Wait for the scheduled task to finish.

Step 7: Checking the output
- Log into your SIEM. Wait a few minutes for the events to be indexed. Search your related SIEM index, such as index=cyberark | search “CyberArk Telemetry”.
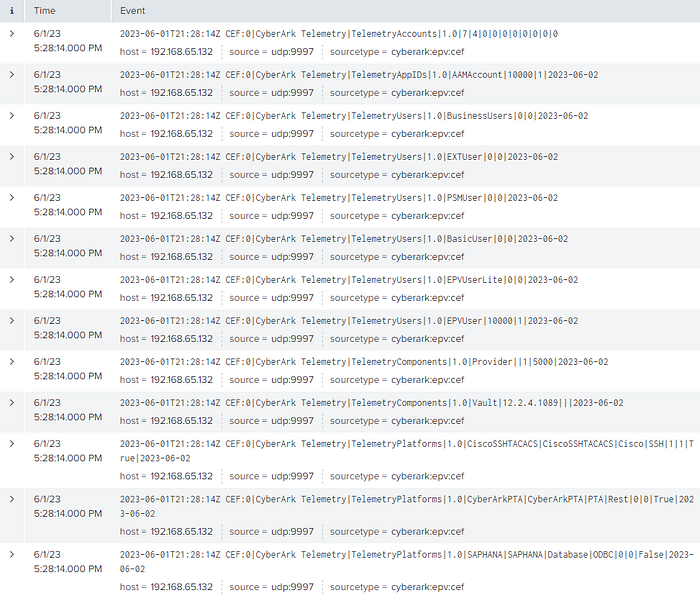
Example SIEM formats to help with your field extractions:
TelemetryPlatforms -
$DateTime CEF:0|CyberArk Telemetry|$MonitorType|$Version|$platformdetailsPolicyID|$platformdetailsPlatformBaseID|$platformdetailsPlatformBaseType|$platformdetailsPlatformBaseProtocol|$platformdetailsCompliantAccounts|$platformdetailsTotalAccounts|$platformdetailsIsActive|$platformdetailsDate
TelemetryComponents -
$DateTime CEF:0|CyberArk Telemetry|$MonitorType|$Version|$componentsComponentType|$componentsVersion|$componentsDeployed|$componentsLicensed|$componentsDate
TelemetryUsers -
$DateTime CEF:0|CyberArk Telemetry|$MonitorType|$Version|$usersUserType|$usersLicensedUsers|$usersAllocatedUsers|$usersDate
TelemetryAppIDs -
$DateTime CEF:0|CyberArk Telemetry|$MonitorType|$Version|$appidsUserType|$appidsLicensedUsers|$appidsAllocatedUsers|$appidsDate
TelemetryAccounts -
$DateTime CEF:0|CyberArk Telemetry|$MonitorType|$Version|$accountsTotalAccounts|$accountsTotalCompliantAccounts|$accountsDayAccountsSecretShow|$accountsWeekAccountsSecretShow|$accountsMonthAccountsSecretShow|$accountsYearAccountsSecretShow|$accountsDayAccountsSecretConnect|$accountsWeekAccountsSecretConnect|$accountsMonthAccountsSecretConnect|$accountsYearAccountsSecretConnect
Recommended items:
- Create whatever SIEM dashboards you like with the Telemetry data sent. You could clone the dashboards CyberArk provides for example.
- Be sure to back up your SIEM Dashboards and related searches.
- Run a least privileged account for your scheduled tasks vs local system
- You can utilize the TelemetryTool2SIEM Powershell script to send to whatever SIEM you have in your environment, it doesn’t have to be Splunk.

Looking for a partner in your Privileged Access Management rollout?
Check out my site here — https://www.keyvaultsolutions.com/pages/contact-us
Related Documentation —
- TelemetryTool2SIEM — https://github.com/aglerj/TelemetryTool2SIEM
- CyberArk Telemetry documentation — https://docs.cyberark.com/Product-Doc/OnlineHelp/PAS/Latest/en/Content/TelemetryTool/Telemetry-intro.htm?tocpath=Administrator%7CUtilities%7CTelemetry%7C_____0
- Better Together: CyberArk Telemetry and Business Intelligence (force.com) by James Creamer
- https://github.com/jcreameriii/TelemetryTool2CSV by James Creamer